How to Analyze Poll Results Without Fooling Yourself
A poll result looks like a fact the second it lands. Forty-one percent, a tidy bar, a clear winner. But a poll is less a measurement than a rumor with a chart attached, and the number in front of you can be exactly right and completely useless at the same time. The skill isn’t reading the winning bar. It’s knowing which results deserve your trust, which ones are noise, and what the losing options are quietly telling you.
The people who answered aren’t your audience
Start with the uncomfortable part. A poll never samples your readers. It samples the readers who saw it, felt something, and bothered to click, which is a narrow, self-selecting slice. On a recipe blog, the people who vote on “Which dessert should I make next?” are your most engaged regulars, not the drive-by searchers who make up most of your traffic. In a Discord, the loud third of the server answers and the quiet two-thirds don’t. This is self-selection bias, and it doesn’t ruin a poll. It just changes what the poll can honestly claim.
Your result describes people who cared enough to vote, which is genuinely worth knowing, but it isn’t a referendum on your whole audience. Treat every poll as a read on your engaged core rather than a headcount of everyone, and you’ll interpret poll data without overreaching. The gap matters most when you’re tempted to act on it: “our readers want X” is a much bigger claim than “the readers who vote want X,” and only the second one is supported.
A dozen votes is a vibe, a few hundred is a signal
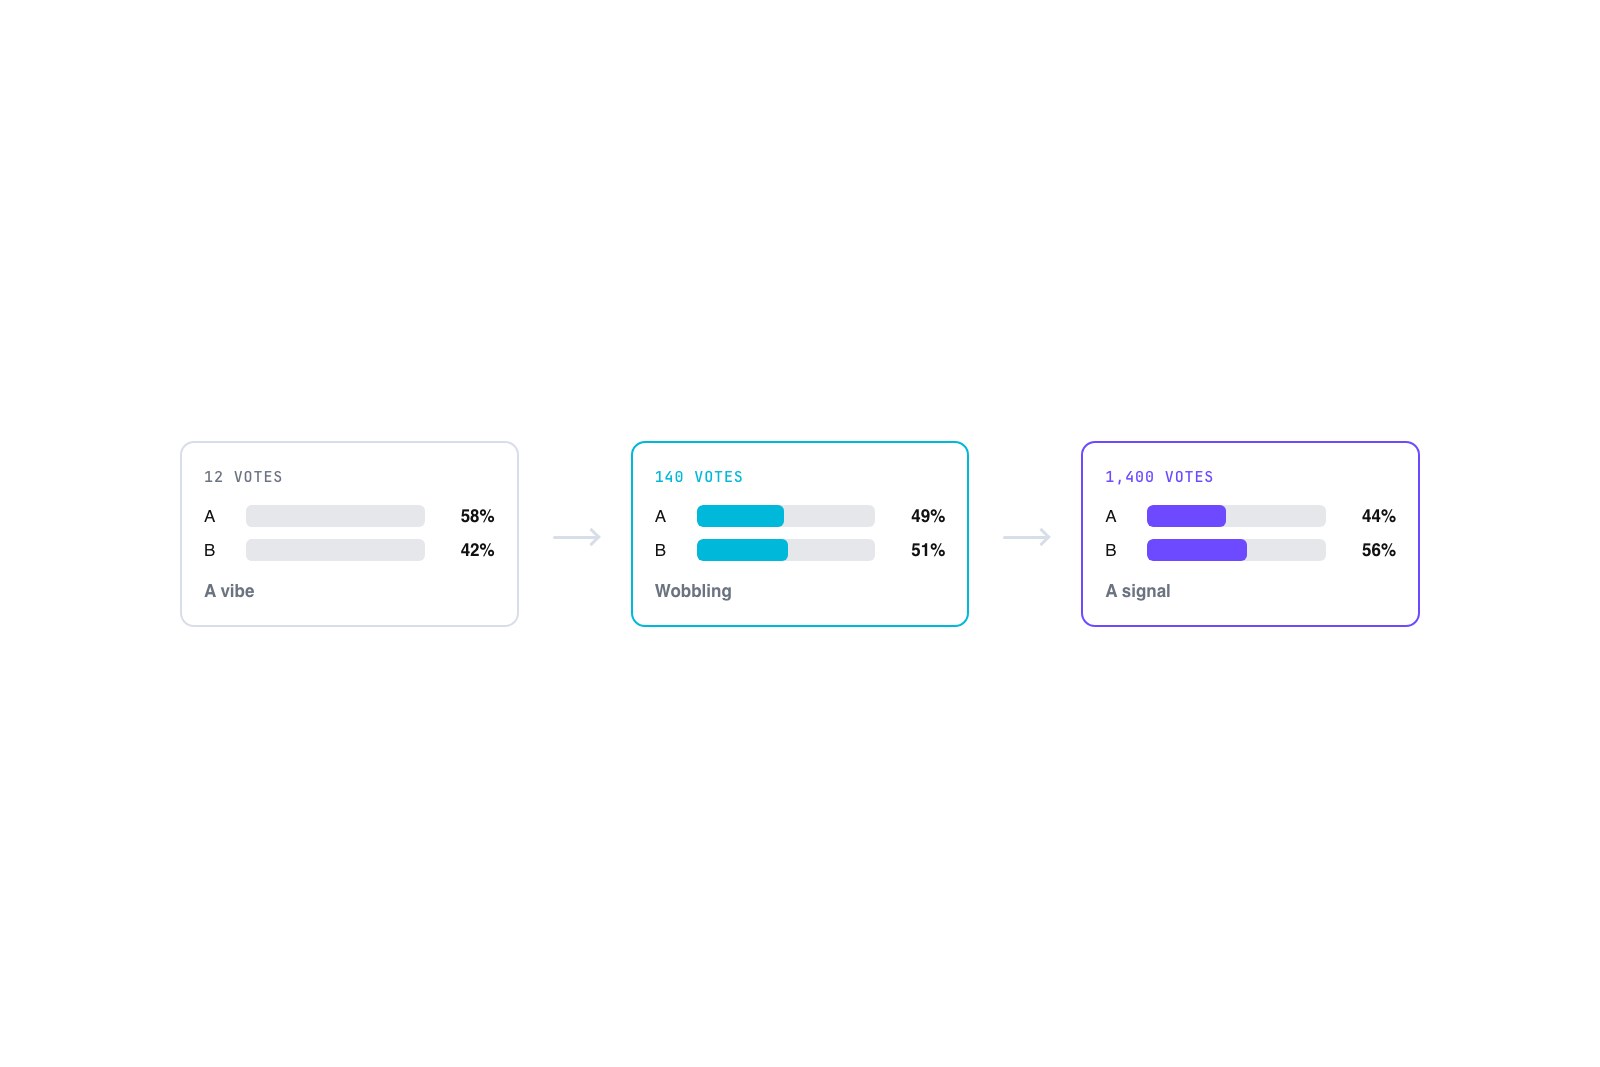
Sample size is the next gut check, and you don’t need statistics to do it well. You need a sense of scale. Twelve votes is a vibe. It might be pointing at something true, but a single afternoon of the wrong twelve people flips it, so don’t rebuild your content calendar around it. A few hundred votes is different. Once a result holds steady after a couple hundred people, the broad shape is probably real, even if the exact percentages keep wobbling by a point or two.
The trap is the early lead. A poll sitting at 8 to 3 in its first hour feels decisive and means almost nothing, because the next fifty votes can erase it. Watch whether the split stays stable as more people arrive. Stability is the signal, not the raw count on any single morning. And resist quoting a sharp percentage off a thin poll sample size. “62 percent prefer the dark theme” off 21 votes reads as false precision to anyone paying attention, and it will come back to bite you the moment someone asks how many people actually voted.
Read the shape, not just the winning bar
The winning option is often the least interesting thing on the chart. The shape of the whole result tells you more. A near-even split, three options all clustered around a third each, isn’t a failed poll. It’s a real finding: the question is genuinely contested, and whatever you were about to decide doesn’t have an obvious answer. That’s useful. It tells you to keep both paths open, or to ask a sharper follow-up instead of forcing a call.
A landslide is the opposite and deserves suspicion. When one bar swallows 80 percent of the vote, the question was usually too easy (“Do you want faster load times?”, which nobody says no to) or the options were lopsided, with one obviously reasonable pick sitting next to three throwaways. A landslide often traces straight back to how the answers were built, which is why the number of answer options you offer shapes the result before a single person votes.
When “None of these” wins, you asked the wrong question
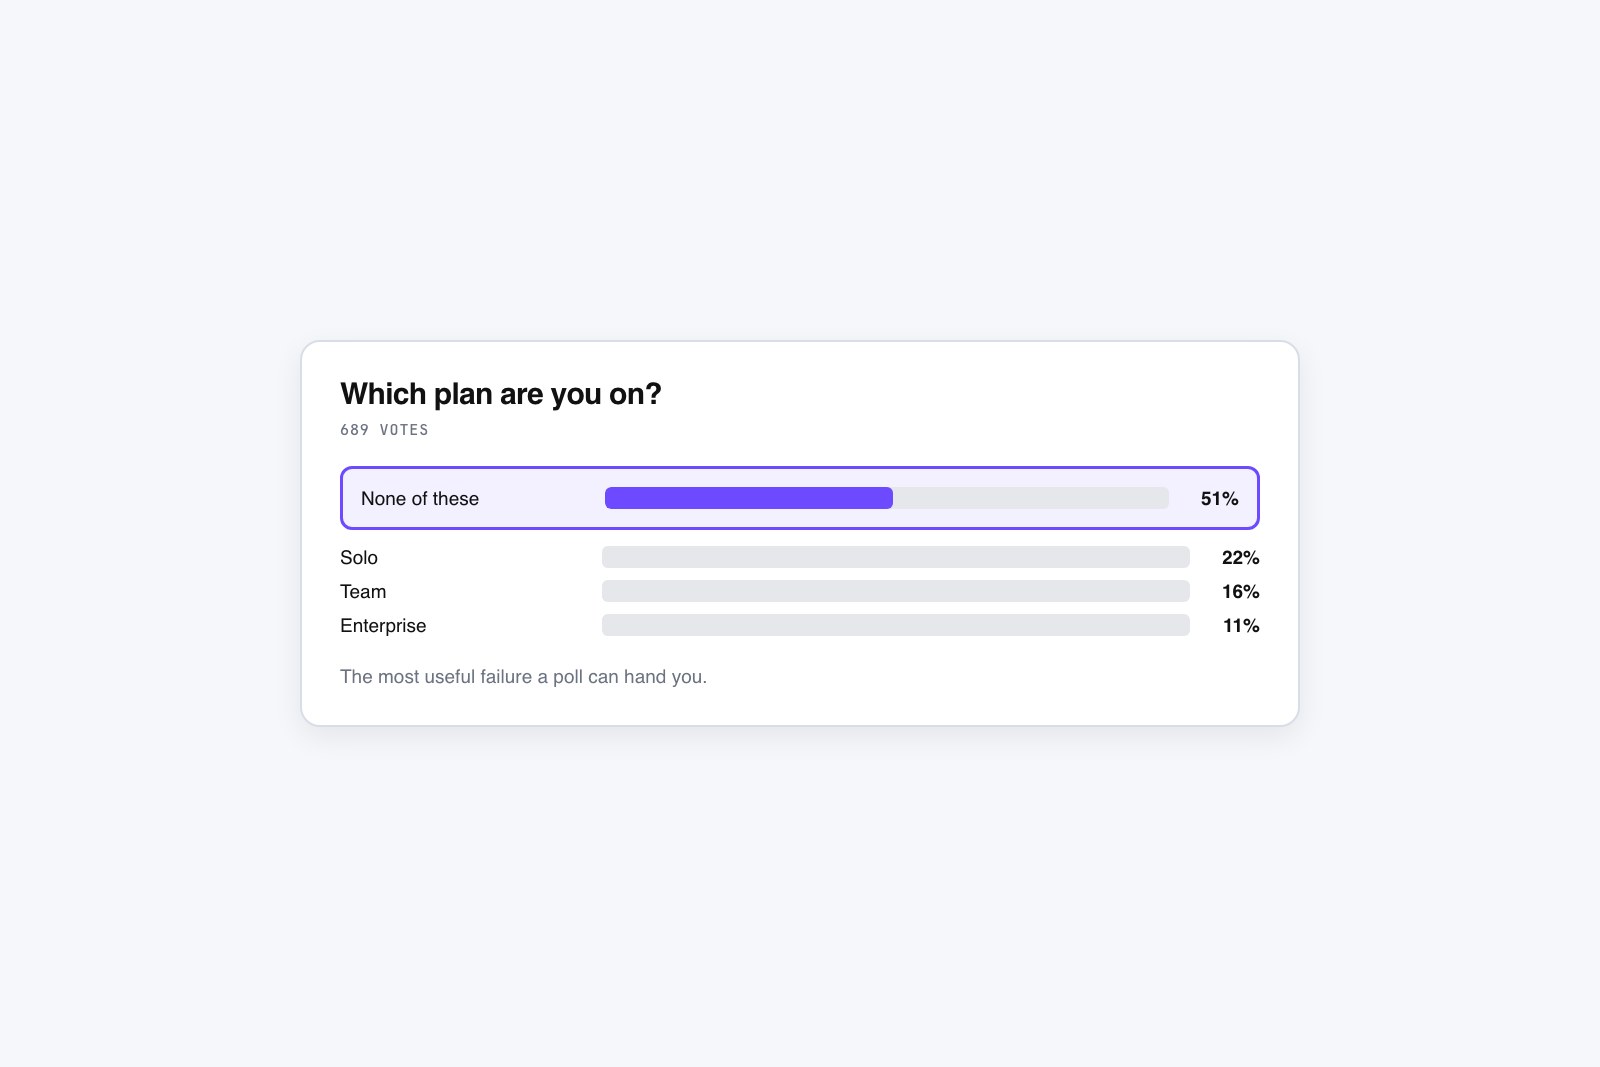
Pay special attention to the escape hatch. If you gave people a “None of these” or “Something else” option and it wins, or even places well, that’s the most useful failure a poll can hand you. It means the real answer wasn’t on your list. A SaaS changelog poll asking “Which of these three features should we build next?” that gets buried by “None of these” isn’t a wasted poll. It just told you your roadmap and your users’ wishlist don’t overlap, which is exactly what you needed to hear before you spent a sprint building the wrong thing.
Don’t quietly delete that result out of embarrassment. It’s the one that saves you money. The reading of poll results here is simple: the fix is a follow-up poll with an open-text field or better choices, not a bigger sample of the wrong question.
Change one thing, then run it again
Here’s the move most people skip. A poll isn’t a verdict you collect once and archive. It’s a loop. Read the result, form one hypothesis about what surprised you or went wrong, change exactly one thing, and run it again. One variable at a time, so you actually know what caused the difference. If a newsletter poll got fifteen votes, don’t conclude your readers are apathetic. Move it from the footer to right under the story it relates to and rerun it before you judge them.
If “None of these” won, swap in the options people actually wanted and ask again. If the split was dead even, sharpen the wording and see whether it breaks one way. When you have a revised version ready, you can rebuild it in about a minute in the GFX Poll Studio creator and drop it back into the same spot. A poll you read, adjust, and rerun teaches you more in three tries than a flawless one-shot poll ever will. The setup choices that shape all of this, the question, the type, and the options, are worth getting right up front, which is what the full guide to creating a website poll walks through.